Lessons Learned
From Training Troubleshooting to Cluster Issues
Before diving into training the model from scratch, we wanted to share some valuable lessons we learned along the way. In this section, we’ll address problems we came across that you might encounter too, and explain how to solve them. These range from model divergence issues to debugging on a cluster and tackling cluster-related configuration problems that can be challenging to debug.
Debugging Model Convergence Issues
TL;DR: We experienced model divergence when changing datasets mid-training due to mismatched data loader states, leading to repeated batches and divergence. By fixing the data loader to match the new dataset and smoothing transitions between data chunks, we resolved the convergence issues.
When your model isn’t converging as expected, it can be frustrating. In an earlier experiment, we tried splitting our data into five smaller chunks of increasing difficulty, each to be trained for two epochs. While this approach isn’t part of the main tutorial, we thought it would be helpful to explain what went wrong and how we resolved the issues.
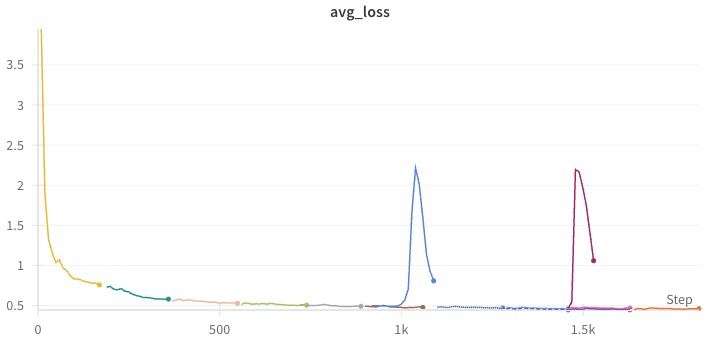
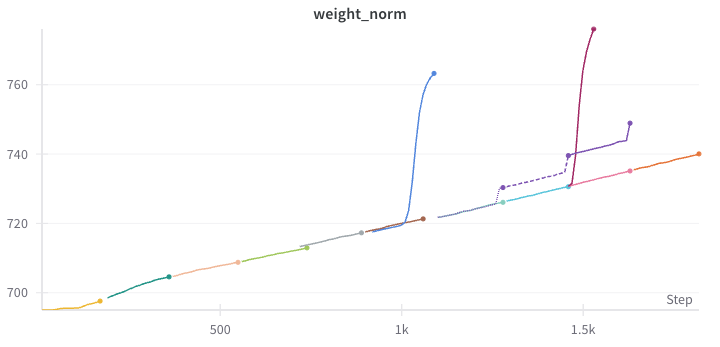
The loss and weight norm curves for the full 10 epochs of training looked like this:
As you might notice, there are three divergence points where we needed to roll back to an earlier checkpoint and restart training, even though we hadn’t changed any hyperparameters.
Problems We Found During Training
The key issue stemmed from how we swapped the sub-datasets. When we switched to a new data chunk, the number of batches changed. We continued training using the --load flag (see Training Section), which meant that the saved data loader state did not match the new dataset. This mismatch led to some batches being shown multiple times in succession.
Since the data loader state was assuming a dataset length different from the actual one, we encountered divergences:
- Blue Curve: When the current index of the pre-calculated batches (from a different number of samples) was greater than expected, the network diverged. We fixed this in an earlier implementation and resumed training successfully (shown in the brown curve).
- Violet Curve: We still had an off-by-one bug in our fix for the data loader. Interestingly, this didn’t lead to divergence, but we saw a sudden but slight decrease in output quality with each new epoch. The outputs became brighter, and we observed small jumps in the average weight norm of the network, happening at the last batch of each epoch. We fixed that off-by-one error and continued training again (shown in the mint curve).
- Purple Curve: Since we tried to increase training speed by splitting data into levels of increasing quality (using the number of nouns in the video descriptions as an indicator), we found that the last jump — from difficulty level “4 of 5” to “5 of 5” — was too drastic. This significant drift in data has led to the divergence seen in the purple curve. Removing the hardest
0.01%of that data solved the problem, and training finished successfully.
Debugging on a Cluster
TL;DR: Our training processes were freezing randomly without errors. Using py-spy, we discovered that garbage collection issues in PyAV within our data loader were causing the freezes. Refactoring the code to use a single PyAV instance eliminated the problem.
When training on a cluster, you might run into issues that are hard to diagnose. Particularly data loader code is inherently highly parallel: on every node in the cluster, for every training job (one per GPU), we have multiple workers (in our case, 16 per training process/GPU) that read data to feed into the training script as efficiently as possible.
Unfortunately, we found that our training froze unexpectedly without any errors — and worse, it happened randomly every 2 to 6 hours. Checking memory usage, CPU usage, and other metrics didn’t reveal any issues.
Training on a large cluster is expensive, so while simple solutions like restarting everything recurrently might seem effective in the short term, we needed a more sustainable fix since stopping and starting the cluster also incurs costs: The training startup is slow due to launching jobs on all nodes, loading checkpoint states, and any just-in-time compilation that might need to happen beforehand.
So, how can we debug a problem like random data loader freezes?
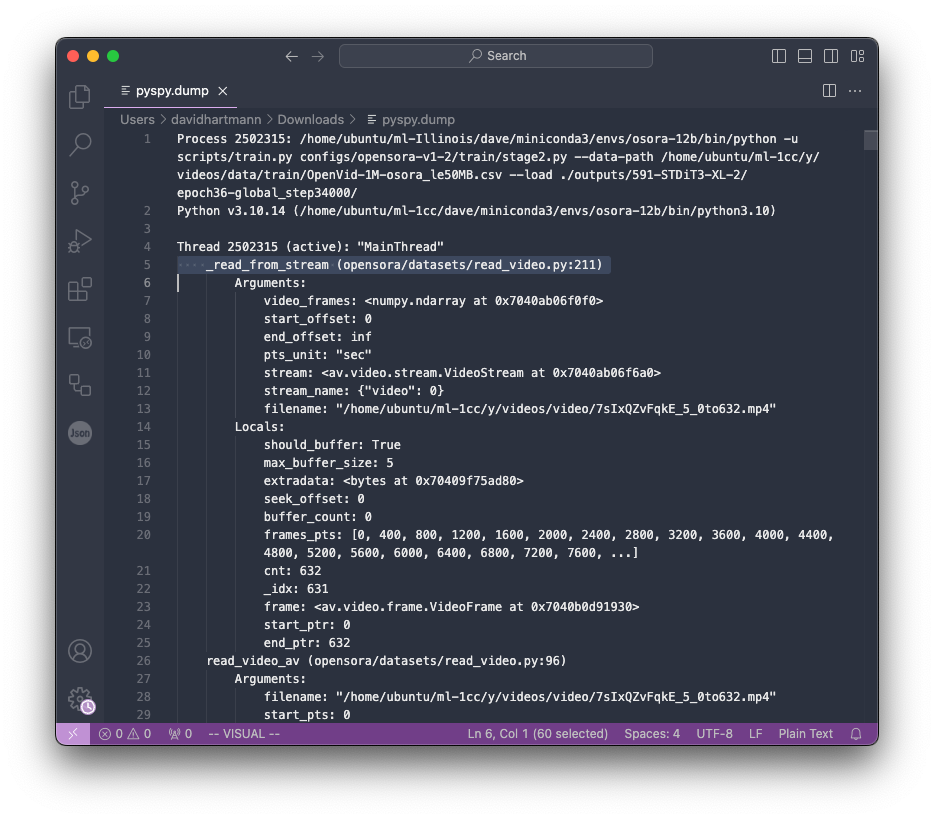
We found that py-spy was invaluable for this task. py-spy has several modes, and we were interested in using the dump feature, which prints out the current process stack trace for a given PID.
We used the following command to run py-spy dump for all workers on all our machines from our head node:
1
 parallel -a nodes.txt -S {} "ssh {} 'pgrep -f python.*train.py | xargs -I {{}} py-spy dump --pid {{}} > ./dumps/{{}}.out'"
We then looked for unusual methods where our processes were spending a lot of time by examining active threads (most other threads in the dumps were idle). By re-evaluating after several minutes, we saw that the same processes were still stuck on the same lines—nothing had changed. The line standing out in the dump is the _read_from_stream method.
Looking at the specific line in the code, we found the following line causing the problem.
1
2
210 result = video_frames[start_ptr:end_ptr].copy()
211 return result
It seemed to be related to garbage collection.
Since PyAV is used under the hood, we checked their documentation and discovered their notes on Caveats related to Garbage Collection, possibly causing freezes due to opening and closing instances frequently. We refactored the code to use only a single PyAV instance, which solved the problem!
Random NCCL Errors
TL;DR: We faced frequent NCCL errors causing training crashes, traced back to clock synchronization issues across cluster nodes. Implementing proper time synchronization using Chrony resolved these errors and stabilized our training runs.
Another issue we encountered was random crashes due to NCCL errors. These crashes happened more regularly, sometimes every 30 minutes, and also required us to manually restart training.
The key error message was:
1
Some NCCL operations have failed or timed out. Due to the asynchronous nature of CUDA kernels, subsequent GPU operations might run on corrupted/incomplete data.
After some investigation, we realized that the issue was caused by clock synchronization problems across the cluster nodes. One of our team members observed that some nodes’ clocks were moving backwards:
“I noticed that one node’s clock jumped backwards—the last line of
dmesgwas a few seconds ahead of the current time on that node. It appears that the polling interval is 34 minutes, and the upstream NTP server is behind this node, causing the clock to slew backwards. The freeze periodicity seems to match this interval.”
The solution was to address the clock synchronization issues by switching the NTP client to Chrony on the cluster head node. This change resolved the hangs caused by NCCL.
Monitoring Model Quality
TL;DR: We regularly evaluate model quality by running inference on the latest checkpoints using a separate server. This ensures that training continues uninterrupted while we monitor the generated videos’ quality.
While tracking loss curves in Weights & Biases provides valuable insights during training, the loss values often plateau after the initial few epochs. This makes it essential to evaluate the model beyond numerical metrics by assessing the quality of videos generated from a set of validation prompts. To do this, we need to run the most recent model weights in inference mode regularly.
However, running inference on a Text-to-Video (T2V) model is computationally expensive. For example, generating videos at 720p resolution, 4 seconds in duration, with a batch size of 2 can takes already X minutes on a H100 — we don’t want the entire cluster to idle while waiting for some nodes to finish evaluation!
To address this, we set up a separate, smaller server to handle inference asynchronously. This allows the main training process to continue uninterrupted, maximizing our computational resources. The inference server runs the latest model checkpoints, generates sample videos, and saves the outputs to the same Weights & Biase runs that training is logging to, as you’ve seen in the result sections above.
Setting Up the Inference Server
Note: Setting up the inference server requires that the codebase and environment are properly configured. Setting up an inference server is something we learned to be highly valuable during our training process. We recommend revisiting this section after you’ve followed the instructions in the (next) Setup section.
The inference server in this repository is designed to work asynchronously and supports several modes. Here’s how you can set it up:
Synchronize Checkpoints
First, we need to synchronize the latest checkpoints from the training cluster to the inference server. If you don’t have acccess to your shared storage on this dedicated inference machine, you can usersyncfor this purpose to query the checkpoints regularly.1
watch -n 100 rsync -avzruP --exclude='*/optimizer' training-cluster:/path/to/your/training/outputs/* .
This command runs every 100 seconds and synchronizes new checkpoints, excluding optimizer states to save bandwidth and storage.
- Initialize the Node & Log In into W&B:
Ensure that both W&B and Open-Sora are properly initialized and functioning on this node. If the node is not included in the cluster where you have previously completed the setup, please refer to the instructions provided in the Setup section. Run the Inference Server
Next, we start the inference server using the desired preset and experiment numbers:1
python scripts/inference-server.py --preset low4s --expnums 656
--preset: Specifies the inference settings. Available options includelow4s,high4s, andlow16s, which correspond to different resolutions and durations.--expnums: Specifies the experiment numbers or checkpoint directories to monitor and execute inference on. The experiment number is used to automatically extract the W&B run-id, enabling the inference server to identify the location to push the results to.
You can explore additional options and features by running:
1
python scripts/inference-server.py --help
For instance, you can run a second server that computes the
720presults.1
python scripts/inference-server.py --preset high4s --expnums 656
By setting up the inference server this way, we can continuously monitor the model`s output quality without interrupting the training process. This approach ensures that our valuable training resources remain focused on model optimization, while inference and evaluation happen in parallel.
Monitoring Cluster Health
TL;DR: Use a tool to monitor cluster performance and to detect early signs of performance degradation.
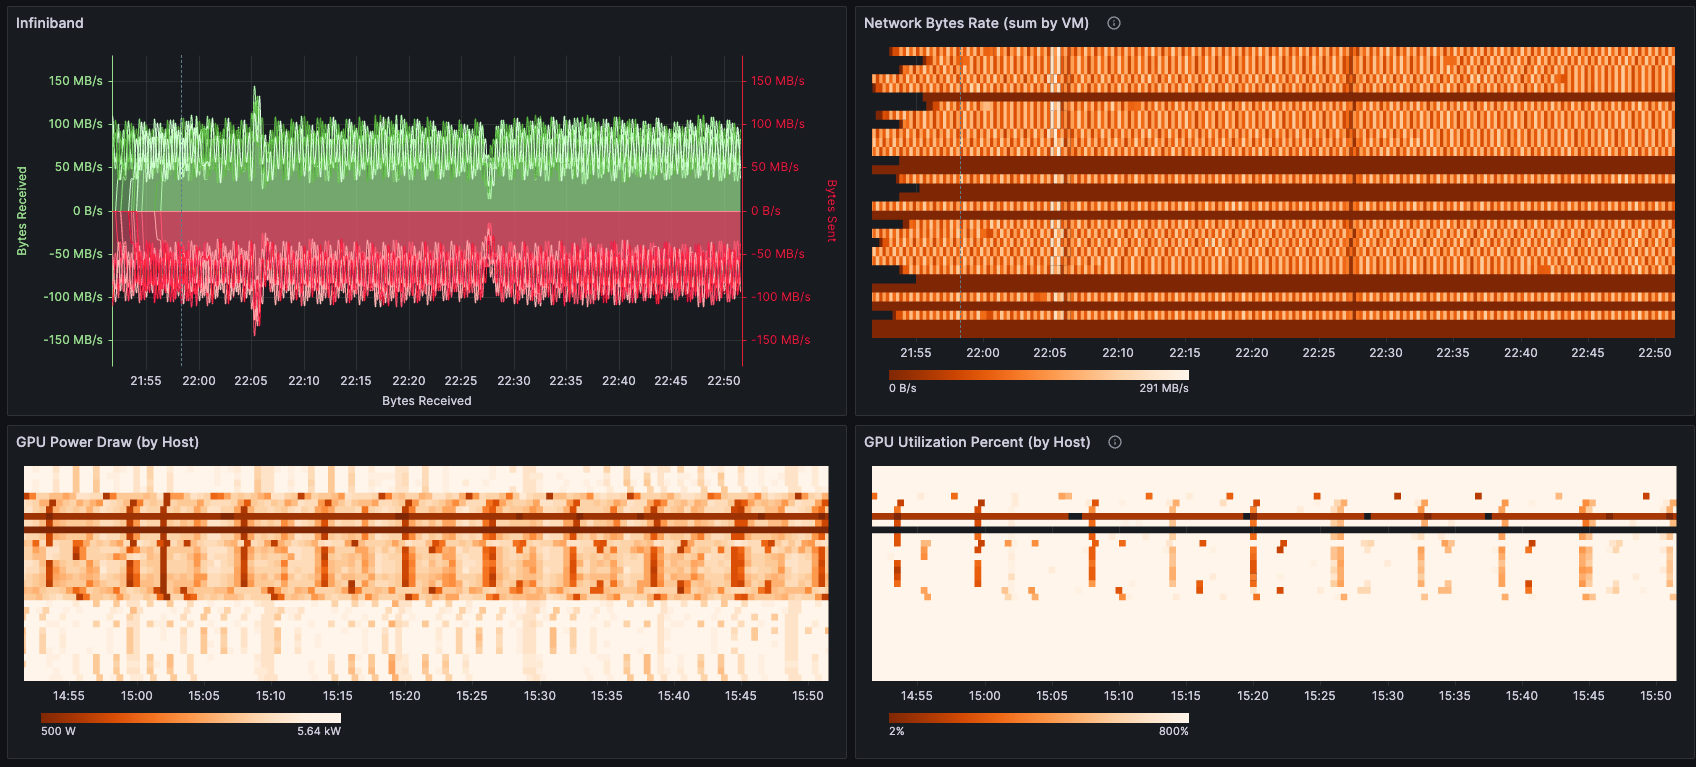
As highlighted in the LLama 3 Paper, large-scale distributed training can often face downtime. We too experienced this firsthand during our training runs. Thus, while your training is running, it’s crucial to keep an eye on the health of your cluster. We use an internal tool to monitor cluster performance, regularly checking for any signs of degrading performance. This tool logs metrics such as power draw across the entire cluster and InfiniBand or Ethernet speeds.
What Next?
With these lessons learned, you can now proceed to the Setup section to set up the codebase and begin training.
We’ll guide you through cloning the repository, installing dependencies, and configuring your cluster. You’ll learn how to create a shared folder, install Miniconda on all nodes, clone the required codebase, and ensure all nodes have consistent environments and access to necessary files. Maintaining uniformity across all nodes is essential, as inconsistencies can lead to challenging bugs during the training process.


